
When simple beats complex
A new approach to understanding cellular communities.

Sometimes, the most profound discoveries come from the simplest approaches.
In spatial biology, technologies generate overwhelming amounts of data, and it's easy to assume that the most sophisticated algorithms are the most effective. Yet, as I discovered during my PhD, there's often great value in taking a step back, starting simple, and letting the data guide your way.
During my Master's thesis, I became fascinated with Graph Neural Networks but didn't get the chance to apply them. As I entered my PhD, I wanted to find the perfect use case for them, and I thought I'd found it.
Once you have a hammer, everything looks like a nail.
However, my aspiration for complex methods unexpectedly led to a simpler, yet powerful solution to the problem.
The problem: spatial domain identification
Imagine you're looking at a city from above. You can see different neighborhoods - residential areas, commercial zones, industrial parks. Each of these areas has its own unique blend of buildings.
This is similar to what we see in biological tissues. Different areas of a tissue have their own unique compositions of cells. We call these areas "spatial domains", “spatial clusters”, “cell neighborhoods” or "cell niches". I talked about this metaphor in a previous post.

Understanding these domains is crucial because they can tell us a lot about how tissues function in health and disease. For example, the same immune cells can organize into different domains and influence the outcome of cancer therapies1.

The Graph Neural Network Approach
When I started my PhD, I was excited about using Graph Neural Networks (GNNs) to identify spatial domains. GNNs seemed perfect for the task, given their ability to process complex spatial relationships.
To understand how GNNs work, let’s return to our city metaphor. Imagine each building (representing a cell) shares information like energy usage and occupancy with its immediate neighbors. The neighbors then share this information with their neighbors, creating a ripple effect throughout the city.

In computational terms, each building updates its state based on the states of its neighboring buildings in a recursive manner. The core idea is that cells (buildings) surrounded by similar neighbors will have similar states, and thus belong to the same spatial domain (neighborhood).
A Pivot to Simplicity: Neighborhood Aggregation
I was all set to apply GNNs to find spatial domains. However, as any good researcher knows, before developing a complex model, it's important to create simple baselines.
This practice offers several advantages:
Deeper understanding: Implementing baselines forces you to grapple with your data and problem, leading to better-informed decisions for more advanced models.
Sanity check: If your complex model underperforms compared to a simple baseline, it may indicate issues with your implementation, data preprocessing, or model design.
Incremental implementation: Baselines allow you to set up your data processing and evaluation pipeline step-by-step, without getting stuck in the complexities of advanced methods (yet).
With these principles in mind, I developed a method called neighborhood aggregation, a simpler, more scalable alternative to GNNs. Here’s how it works, using our city metaphor:
Buildings’s data: For each building, we gather data like energy usage and occupancy.

1-hop neighbors’ data: We then move to the immediate neighbors (1-hop neighbors) and average their data. This gives us a set of average energy and average occupancy that we attach to the original building’s data.

Aggregating data from immediate neighbors. 2-hop neighbors’ data: We repeat this process for neighbors of neighbors (2-hop neighbors), again averaging their data and concatenating it with the previous values.
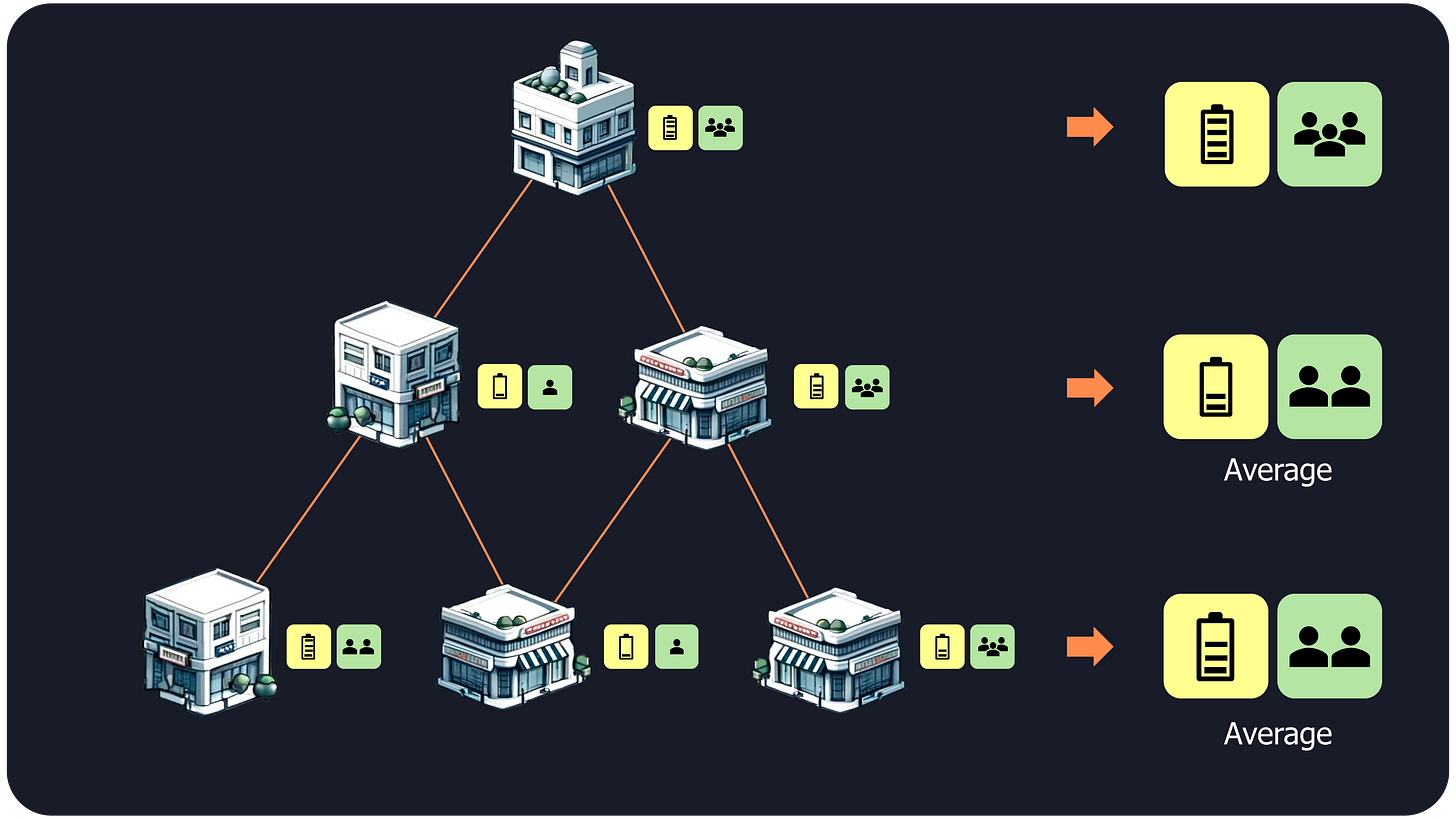
Aggregating data from 2-hop neighbors. N-hop neighbors’ data: We continue until a maximum distance is reached, which is usually around 2 or 3 jumps.
Domain identification: the concatenation of these N+1 sets of energy and occupancy data are used to groups buildings with similar values (also known as clustering).


Unlike GNNs, neighborhood aggregation is not recursive, making it much more scalable. It can incorporate information from all neighbor layers at once, capturing essential spatial relationships without repeatedly updating each cell's state.
This simple algorithm ended up being the main component of CellCharter, the method I developed throughout my whole PhD2.
Results and Implications
When we applied CellCharter to a spatial proteomics dataset of mouse spleens, the results were exciting. Our simple method identified domains that closely matched the known anatomical regions of the spleen, as annotated by an expert pathologist, and additional, more refined, domains.

This was a significant finding because it showed that even a straightforward approach could yield biologically meaningful insights. The method's simplicity also made it highly scalable, an important feature as the volume of spatial omics data continues to grow.
How to Apply This Approach to Your Research
This experience confirmed once again the principle of implementing simple baselines before shiny cutting-edge methods. These are the main takeaways:
Start simple: Beginning with a basic approach can provide valuable insights and sometimes lead to unexpected breakthroughs.
Balance novelty and utility: While it's exciting to work with cutting-edge methods, sometimes a straightforward approach that solves a real problem is more valuable.
Stay flexible: Be prepared to pivot your research direction based on your findings. Some of the most interesting discoveries come from unexpected results.
It’s easy to get caught up in the excitement of new techniques, but sometimes the simplest approaches can lead to the most impactful results.
The hidden allies of cancer

In cancer, even the normal cells can become key players, sometimes helping the tumor instead of fighting it.